Construction of fuzzy multinomial statistical control charts for the air quality index of major cities in India
Abstract
Control charts are used as the most important statistical tools to recognize the irregular situation in a process. The p-control chart is the widely used tool to monitor the attribute characteristics of more than one variable simultaneously. It classifies each unit into defective or non-defective according to the quality characteristics. But in practical situation, there are many categories exist such as excellent, good, medium and bad. In this paper, Fuzzy Multinomial Control (FMC) chart is constructed to handle the vague situations of data and also to identify the quality of Air Quality Index (AQI) for the major cities in India.
Published
2022-01-01
Issue
Section
Articles
How to Cite
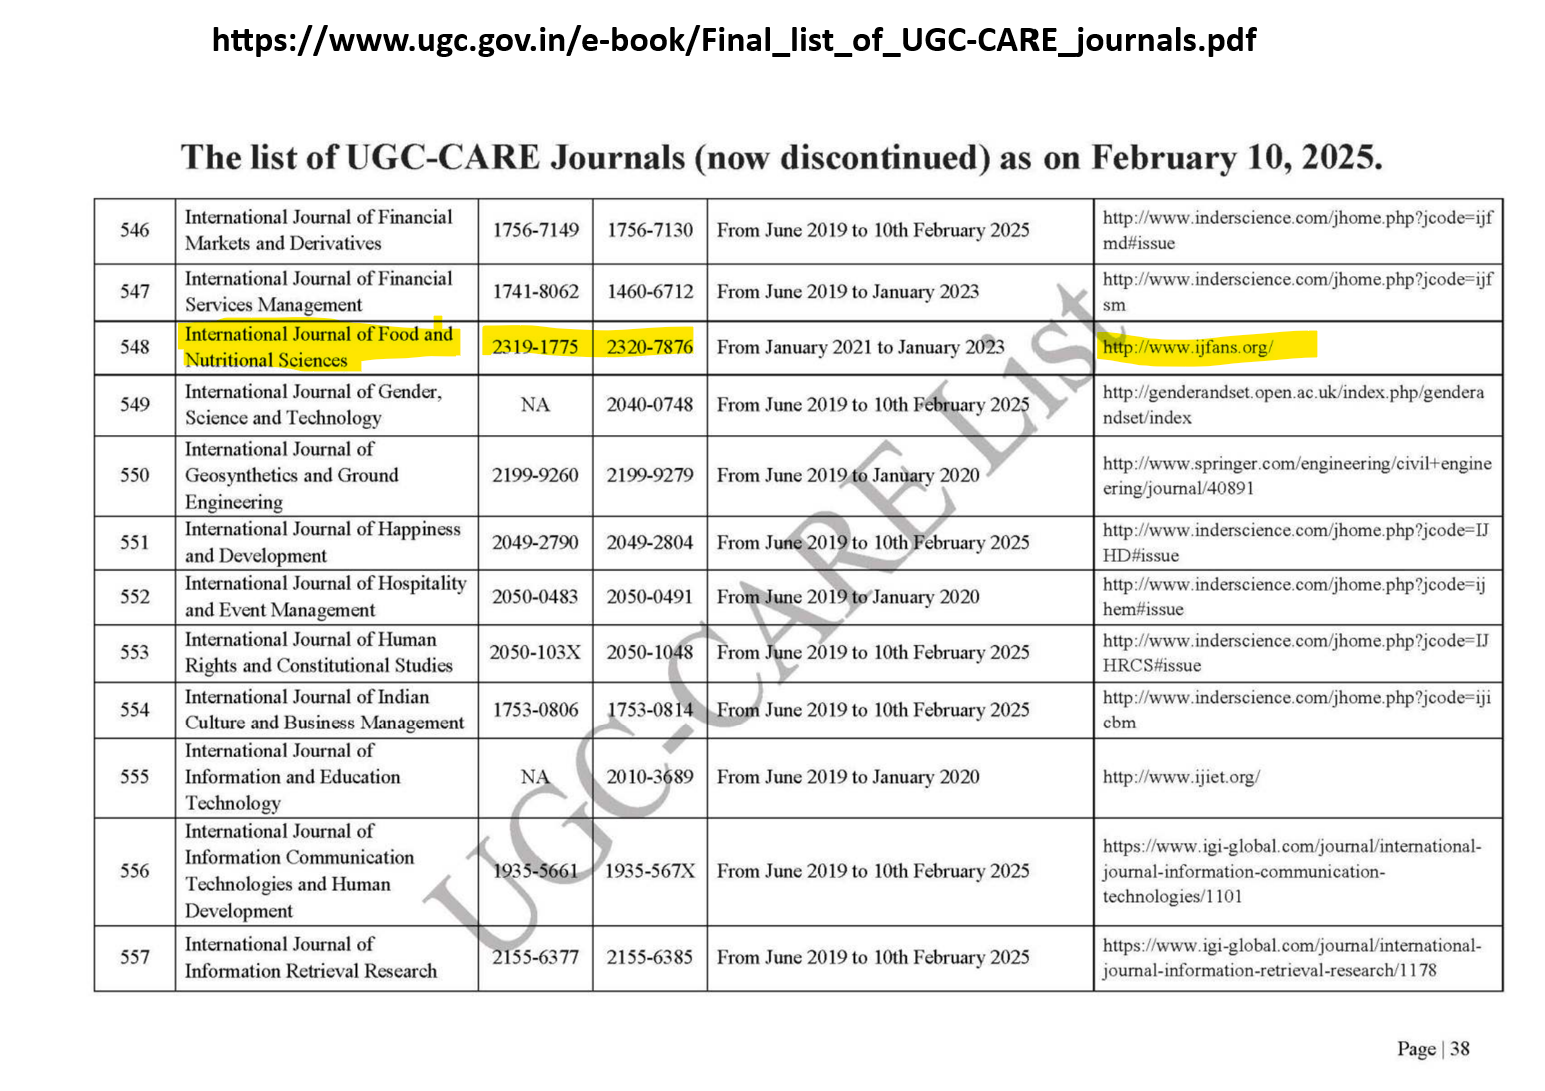
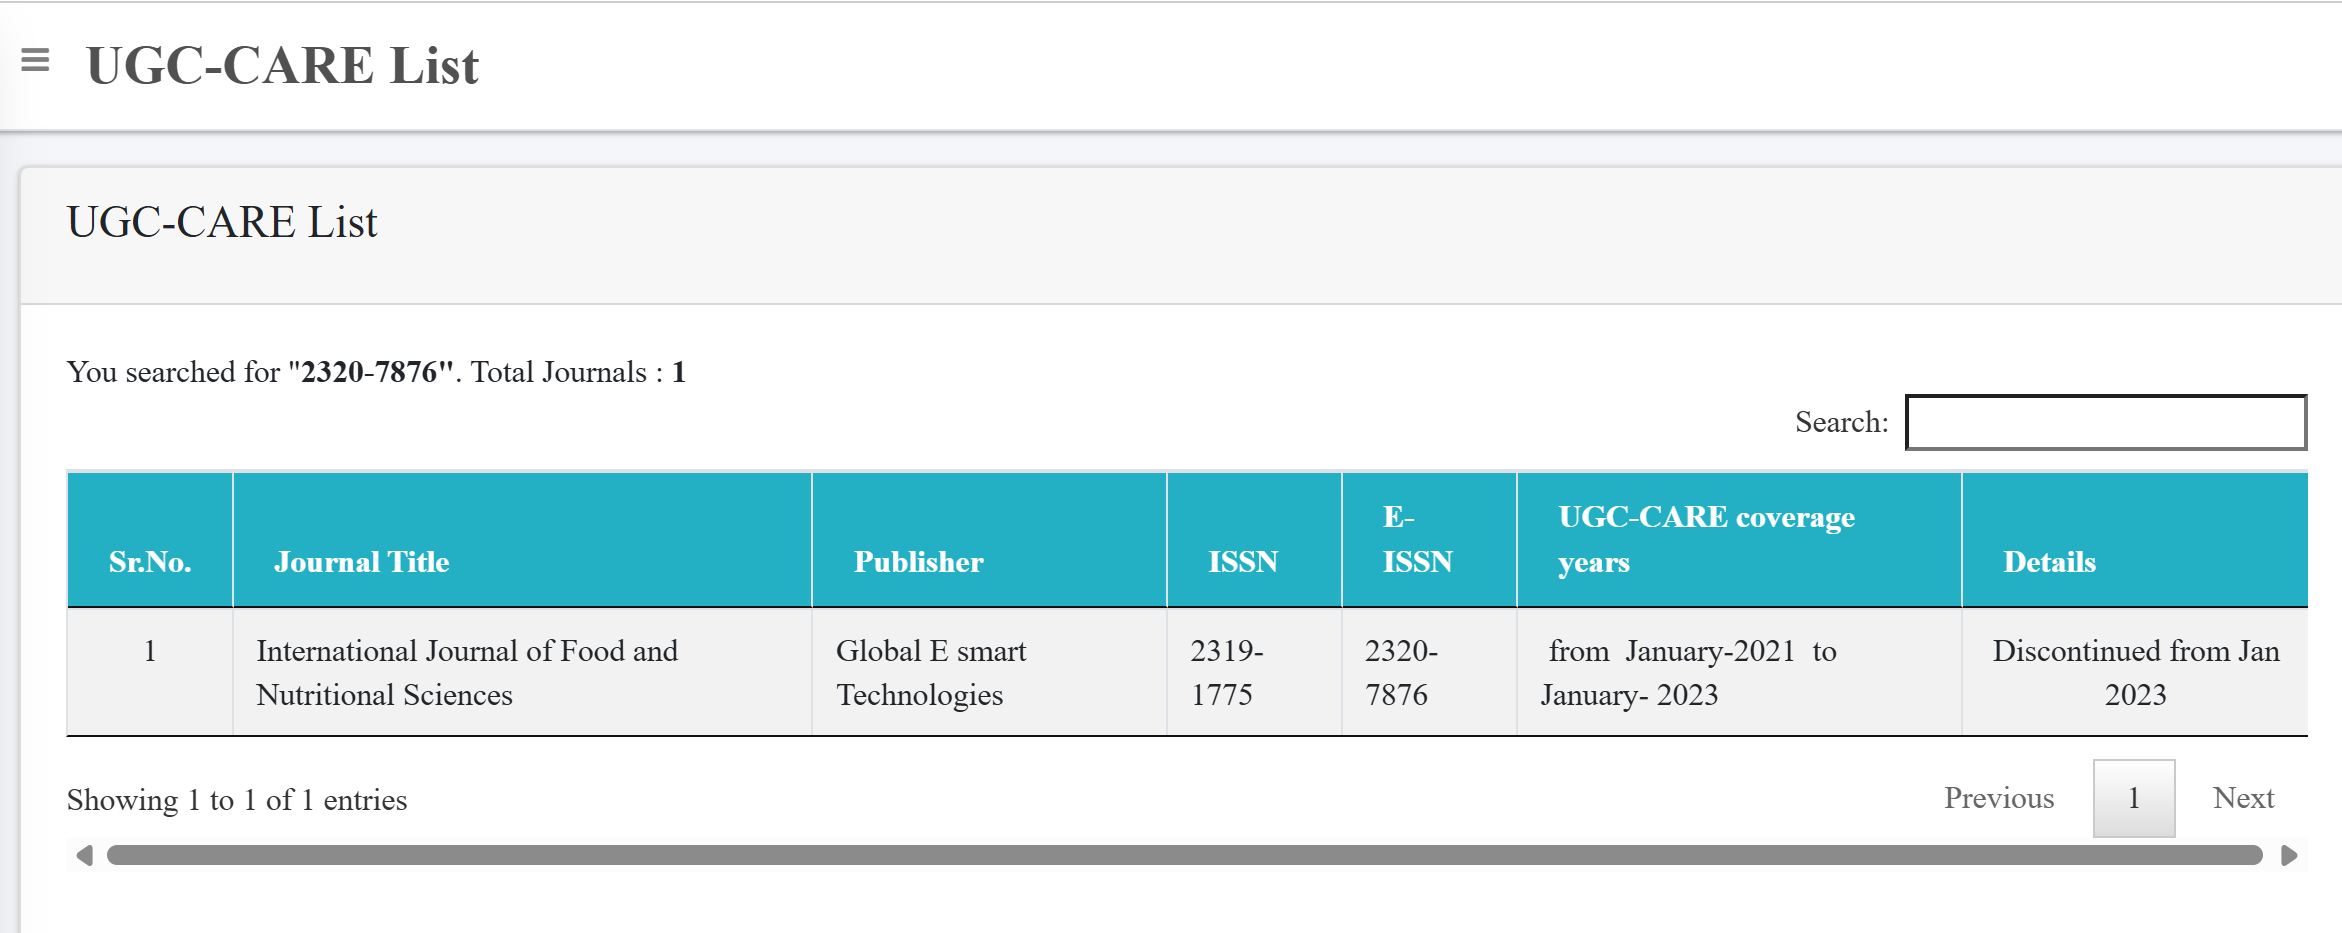
Construction of fuzzy multinomial statistical control charts for the air quality index of major cities in India. (2022). International Journal of Food and Nutritional Sciences, 11(Special Issue 1), 1920-1925. https://ijfans.org/index.php/Journal/article/view/6430